California-Wildfire-Ignition-ML-Modeling
Geospatial Machine Learning for Wildfire Ignition Risk in California
Author: Dustin Littlefield
Portfolio: GitHub Portfolio
Project Type: Spatial Data Science Remote Sensing Wildfire Analysis
Technologies: Python ArcGIS GeoPandas Scikit-learn XGBoost
Last Updated: March 2026
Overview
A machine learning analysis to predict wildfire ignition risk in California using demographic, spatial, and environmental data collected over 6 years.
Tools: Python, scikit‑learn, Pandas, Rasterio, ArcGIS Pro
Focus: Wildfire ignition, ML modeling, environmental analytics, Spatial analytics, Time Series
Data
Fire Incident Data
- Wildfire damage (DINS) — CAL FIRE https://data.ca.gov/dataset/cal-fire-damage-inspection-dins-data - Wildfire incidents — CAL FIRE https://www.fire.ca.gov/incidentsEnvironmental Data
- Daily weather (gridMET) — Climatology Lab https://www.climatologylab.org/gridmet.html - Land cover (NLCD 2021) — USGS https://data.cnra.ca.gov/dataset/nlcd-2021-land-cover-california-subset/resource/6dab6b30-88ae-4aec-af8c-c22d52593c75 - Daily NDVI — NOAA https://doi.org/10.25921/gakh-st76California Demographic Data
- Census tracts & blocks — U.S. Census Bureau https://catalog.data.gov/dataset/tiger-line-shapefile-2021-state-california-census-tracts - ACS 2024 median income — U.S. Census Bureau https://data.census.gov/table/ACSST1Y2024.S1903?q=California+Income&g=010XX00US$1500000_040XX00US06$1400000,06$1500000Wildland–Urban Interface (WUI)
- WUI layer — CAL FIRE https://gis.data.ca.gov/datasets/CALFIRE-Forestry::wildland-urban-interface/explore - CDFW regions — CA Dept. of Fish & Wildlife https://data.ca.gov/dataset/cdfw-regions - Eco‑regions — USDA Forest Service https://data.fs.usda.gov/geodata/edw/datasets.php?dsetCategory=biotaElevation
- 1/3 arc‑second DEMs — USGS National Map https://apps.nationalmap.gov/downloader/Infrastructure
- Public roads — CalTrans / USGS National Map https://apps.nationalmap.gov/downloader/ - Transmission lines — California Energy Commission https://www.arcgis.com/home/item.html?id=aaa6321660eb40bbb55755d5cfb64107Methods
Data Preparation
- All datasets collected from official state and federal sources
- All ArcGIS layers are projected to a common CRS (EPSG 3310) and clipped to California state boundaries.
Feature Engineering
- Constructed a relative NDVI hot spot index comparing each grids local mean to the global mean
- Created interaction features focused on targeted combinations of weather features and social data.
Modeling
- Trained tree based ML models to predict categorical Ignition targets on individual pipelines.
- Automatic hypertuning for optimal performance based on macro F1 scores.
Spatial Interpolation
- Built a custom ArcGIS Pro automation tool to standardize output workflow and consistency.
- for a target date, runs kriging for the two prediction sets and one actual results set.
- clips all output rasters to California boundaries
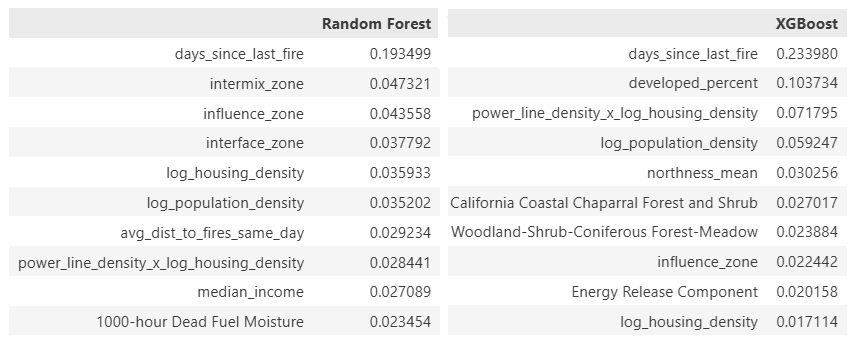
Results
Key Findings:
- the models are quite good at reliably identifying low‑risk grids, largely because the patterns associated with ‘no wildfire activity’ are abundant, consistent, and easy for algorithms to learn.
- XGBoost currently overfitting the target value.
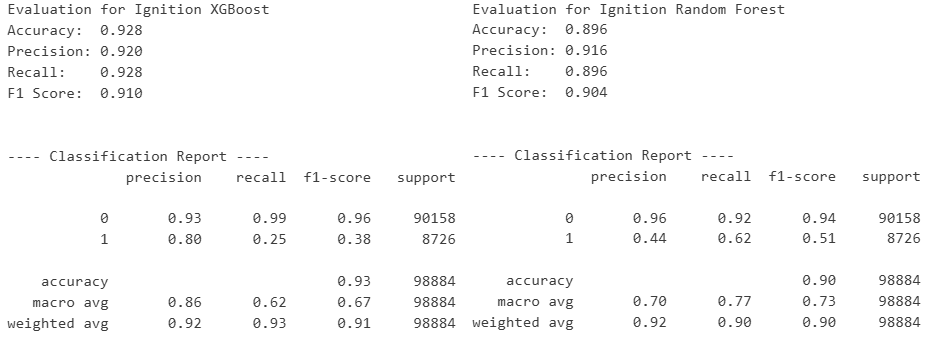
- Indicators of drought and dry fuel materials are the leading drivers among environmental factors.
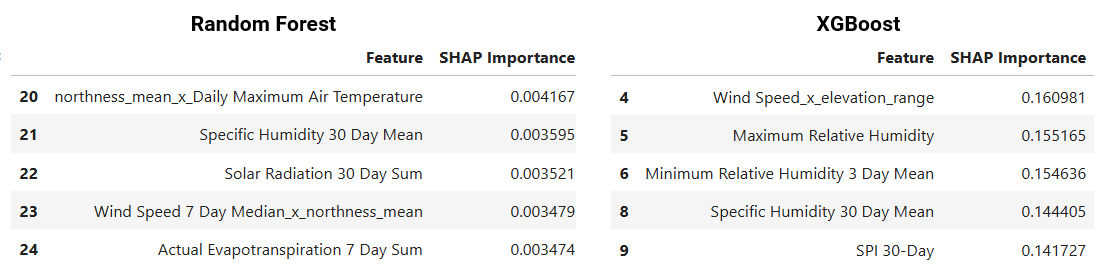
- Population density in wildland intermix zones are the top drivers of the XGB wildfire ignition model.
- Overall, the intersection of human habitation and infrastructure with dense forests weigh heavily in all models. Notably in areas where there are both dense power lines and roads.
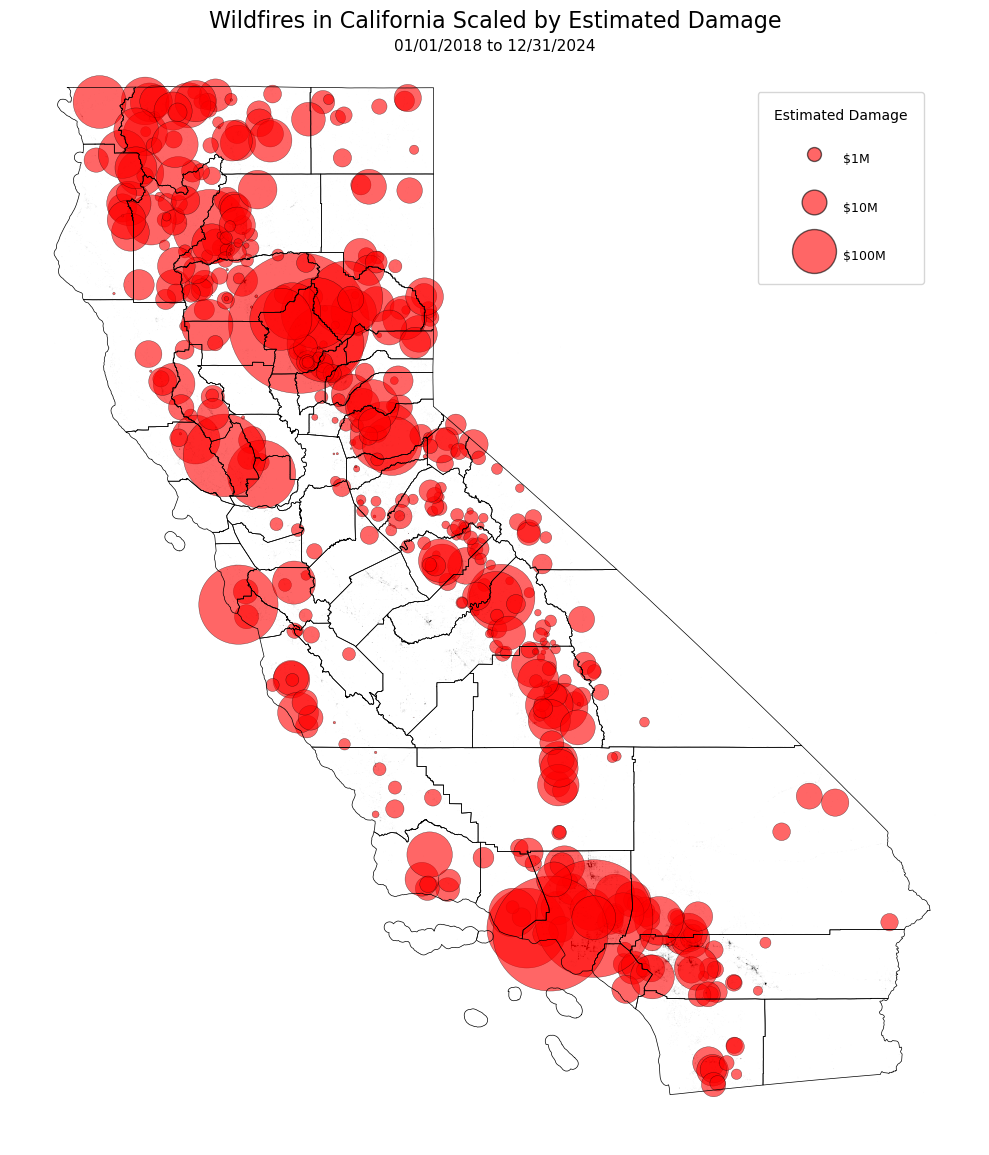
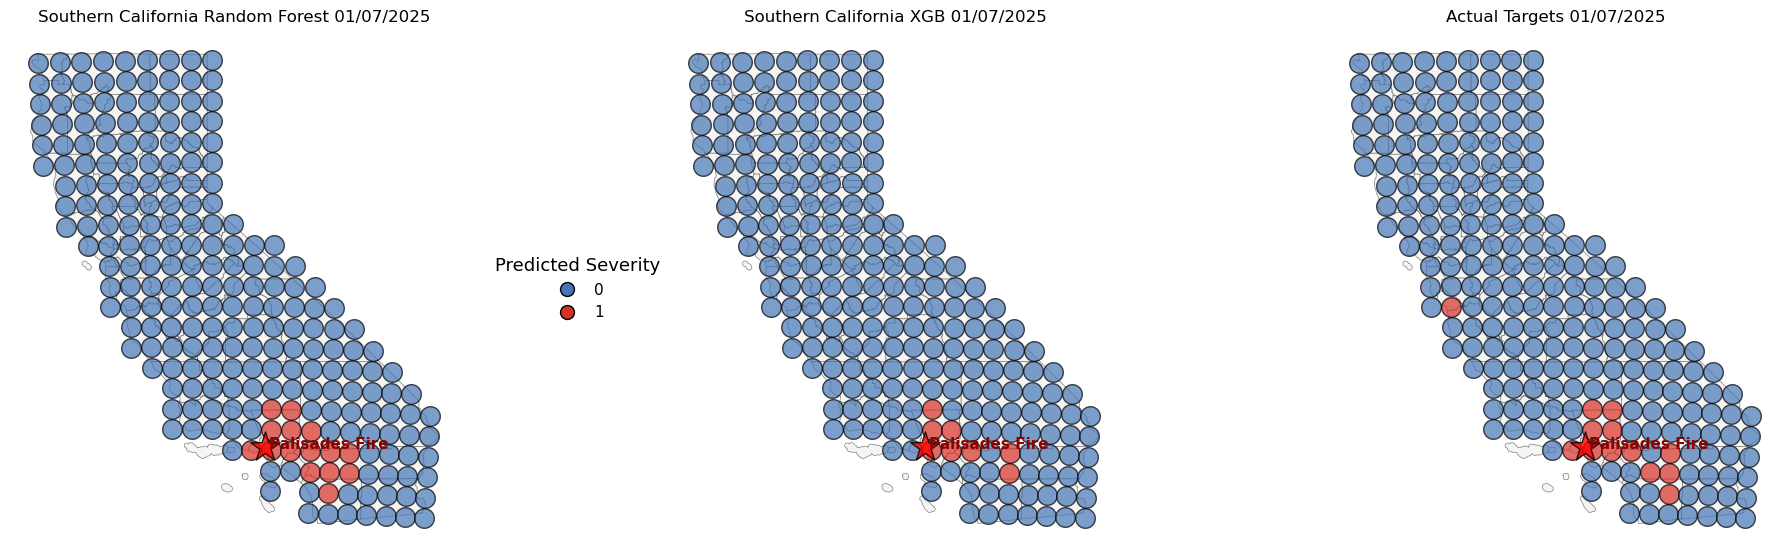
Case Study Visualization
Wildfire Ignition Predictions:
Project Structure
- California_Fire_Severity/
- data/
- raw/
- processed/
- maps/
- output/
- plots/
- src/
- data_utils.py
- model_utils.py
- plot_utils.py
- notebooks/
- Data Exploration
- Data Joining & Preprocessing
- Feature Analysis
- Modeling & Tuning
- Appendices
- README.md
- data/
Next Steps / Potential Improvements
- Hot Spot analysis of daily NDVI raster data (in process)
- Spatial correlation examination with Morans I. (in process)
- ArcGIS online integration.
- Time series maps to check models consistency over time
- Seperate module for up to date processing of new information and real time predictions
- Consult domain experts to validate assumptions and feature selection.
Challenges
Heavy Class Imbalance
Even in California, total days with wildfire events are rare compared to the number of days with no significant events. The low risk class composes the overwhelming majority of the total data points. Ignition events only compose 7% of the 600,000+ grid readings.
Messy Real World Data
You don’t have to get far from clean, well‑curated datasets before you run into the real messiness of actual data. Agencies do solid work organizing what they need, but connecting all those pieces is another challenge. You end up dealing with big gaps, missing or low‑resolution spatial info, and the occasional random error that throws everything off. Some days it feels like a data rodeo and sometimes the bull wins.
Fire Complexity
Large, damaging fires can burn for days and grow at very different rates, and many datasets don’t consistently track containment times. Because of that, relying only on ignition dates makes it difficult to accurately model factors like fire reignition, fires spreading, and how much damage they ultimately cause.
Spatial Resolution
My current hardware limits how finely I can analyze the state. As a result, some variables, like slope and wind speed, get averaged out or flattened, leading to overgeneralization and loss of important detail.
Identifying and Preventing Data Leakage
I chalk this lesson up to being a classic rookie mistake. I initially believed I understood how to avoid data leaks, but I have learned that they can be subtle and deceptive. Often, moments where i feel ‘finally nailed it’ are followed by the sudden realization that there is liekly an apparent leak hiding somewhere. As a result, I now approach any sudden performance bumps with caution and double check any feature engineering or introduction of new data.
Maintaining a Cohesive Project Structure
This project began as a simple Jupyter notebook page, soon expanded to five, and has now grown into 12+ modules, 4+ appendices, and multiple source files. As the project scales, handling and passing data throughout these modules has become more complex and sometimes bugs or changes became more difficult to trace and more time consuming. Consistent organization throughout modules along with clear communication of inputs and outputs are now essential to keeping the structure manageable and growing.
Learning the Proper time to Document and Analyze Variables
There is no argument that documentation and analysis are crucial elements of a project. Ultimately, I have spent hours documenting variables and structures that appeared complete, only to have to be completely rewritten or revised. I now document with simple headers and critical notes only, reserving more detailed documentation for when a module is closer to completion. This approach ensures I maintain clarity and speed throughout development.
Limitations and Disclaimer:
Derivation of Target Values: To maintain simplicity in the initial modeling framework, wildfire target variables are derived from single, outcome‑based metrics.
- Ignition is modeled as a binary classification target, determined solely by whether at least one fire occurred within a grid cell on a given day.
While these single‑variable targets provide a straightforward starting point, they do not capture the full complexity of wildfire behavior. Factors such as suppression efforts, fuel continuity, ignition source, topography, and meteorological interactions may influence each target in ways not reflected in these representations.
Unvalidated Features: While all core features were retrieved from official sources, some engineered and interaction features used in the modelling process remain unvalidated by subject matter experts. For now, these may be introducing unintended bias but will be reviewed extensively in the future.
Personal Project: This project is a personally developed learning effort and may contain statistical inaccuracies. While every attempt has been made to apply sound analytical practices, there are inevitably areas where my current knowledge is still developing. The goal is to refine these skills and improve methodological rigor as the project evolves.
Disclaimer: I am not a climate scientist or wildfire expert. This project is intended to demonstrate data science, geospatial, and machine learning skills. It is not designed for operational use or policy decisions.
Changelog
Version 5.0 Changelog
- Discovered and fixed a major temporal leak, affecting performance of all three targets. As a result, I trimmed the project down to Fire Ignition only, with plans to gather better fire data for spread and damage models in the future.
- Trimmed variables being modeled to both speed up performance and construct a more ignition focused model.
- Expanded SHAP and feature ablation sections.
Version 4.0 Changelog
- Seperated targets into three main models, Fire Ignition, Fire Spread, and Fire Damage.
- New Datasets
- Detailed Elevation incorporated (slope, aspect, northness, eastness)
- Infrastructure data (road density, power line density)
- Land Cover raster data
- New refined and detailed ArcGIS worklow
- Changed samples from points to a raster grid structure to ensure even coverage of the state with minimal overlap.
- Removed the Neural Network due to consistent poor performance (may be due to hardware limitations)
- Incorporated interaction features modeling
Slope x Wind,Human x Environment,Wind Speed x Dryness- Added one hot encoding of regional and temporal fields.
Seasons,Eco Regions- Expanded the target to take into account the
Days Burnedof each fire, since fire spread and damage do not only take place on the day of ignition.
Version 3.0 Changelog
- Incorporated more accurate and complete raster weather data from gridMET Climatology Lab
- Integrated Wildland Urban Interface and California Eco regions.
- Replaced the
KNNmodel with aNeural Networkfor a simpler data workflow.- ArcGIS Pro integration for data preparation and prediction interpolation
- Added more accurate Census Block data. Population stats calculated as buffer zone around sampling points.
Version 2.0 Changelog
- Added Detailed fire damage data
- CALFIRE damage cost data added,
- Estimation of damage directly from structures
- Expanded the dates for weather and damage data
- Expanded from 2018-2020 to 2018-2025
- New Features
Fire Historyaverage fires per month for previous years- Data Handling Optimization
- Simplified handling of case study data as references instead of storing separate databases
- Geographical and Temporal Integration
- in ArcGIS, constructed a mesh sampling grid in California to ensure even coverage
- Buffer spatial join for combining fire damage info with weather data
- Incorporated Regionality and Seasonality into models.
Installation
To run the project locally:
git clone https://github.com/dustinlit/wildfire-severity.git
cd wildfire-severity
pip install -r requirements.txt
License
This project is released under the MIT License. See LICENSE for details.